Making ideas visible
An experiment in publishing research.
Real components in a plain host page, without the Alkemist layout or global theme.
const damping = 0.25;
const frequency = 2;
const duration = 10;
const samples = 300;

const omegaD = frequency * Math.sqrt(1 - damping ** 2);
const displacement = (t: number) =>
  Math.exp(-damping * frequency * t) * Math.cos(omegaD * t);

const points = Array.from({ length: samples }, (_, i) => {
  const time = (i / (samples - 1)) * duration;
  return { time, value: displacement(time) };
});Synthetic data
Synthetic data with damping ratio 0.12.
Chart loads when visible.
Inspect the prepared rows plotted in this chart, or save the current chart view.
The table loads alongside the chart.
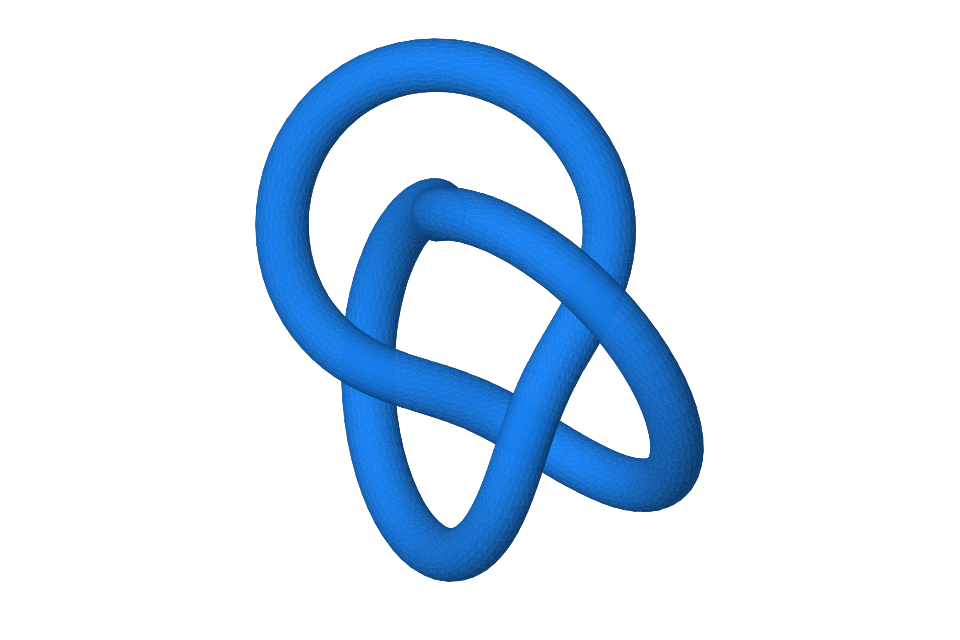
Drag to inspect this generated teaching mesh.
Drag to orbit · Shift + scroll to zoom
Interactive view loads when visible.
Shader loads when visible.
A synthetic 30-second listening study.
Download audio ↓0:00 — A quiet 220 Hz tone. 0:10 — The tone rises to 330 Hz. 0:20 — The tone rises to 440 Hz, then fades out.
Synthetic motion and tones, with two caption languages and three chapters.
Download video ↓0:00 — Blue waves drift across the frame over a low tone. 0:10 — The tone rises as the wave pattern continues. 0:20 — The final higher tone fades out with the study.
Edit a phrase, compare the voices, and export the result.
This content gives the navigation a real destination.
Heading depth determines indentation.
Scroll this preview to see the active section change.