Articles, decks, and live figures
Separate reading layouts, shared presentation controls, and figures you can inspect.
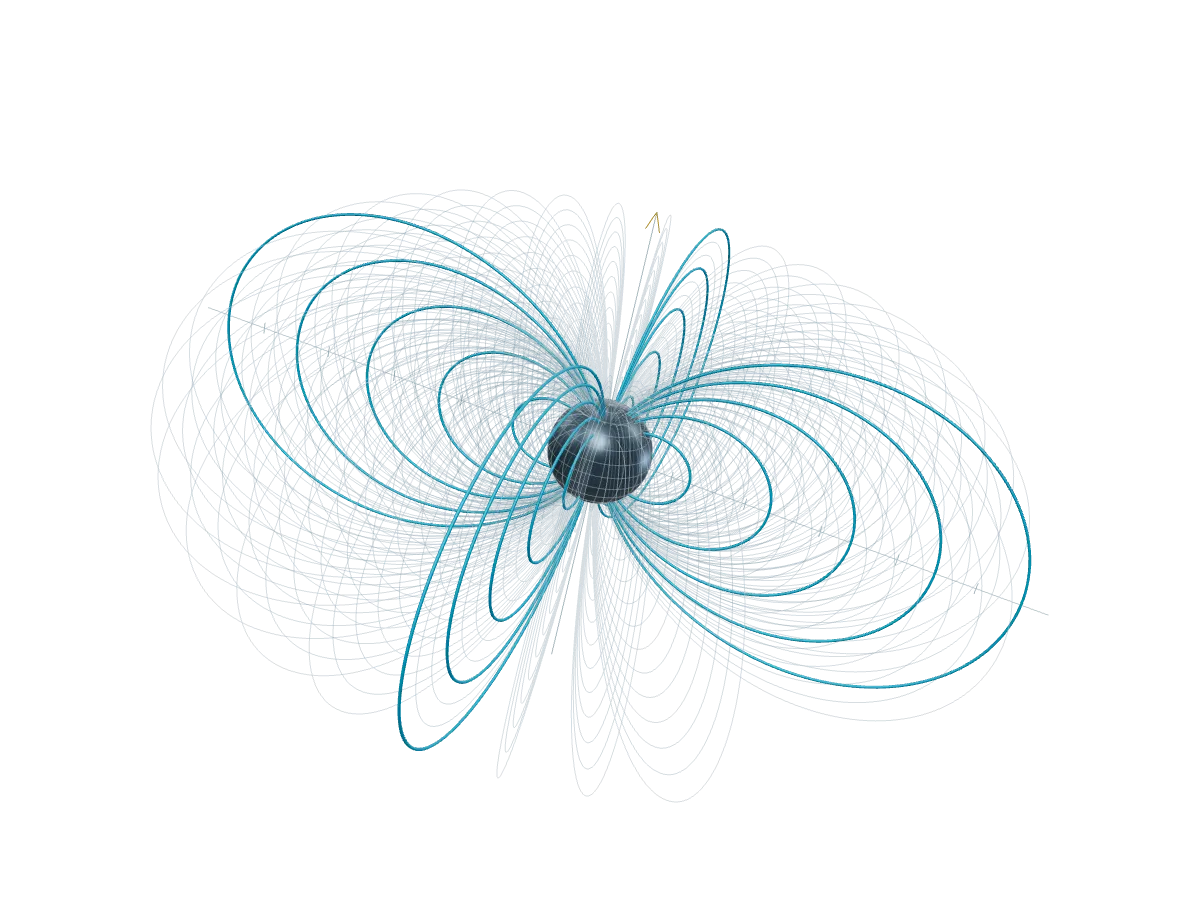
Two kinds of page
An article builds an argument in a continuous column. A deck gives each observation its own frame. They share Markdown, figures, themes, and presentation controls, while keeping distinct reading layouts.
The public components now make that distinction explicit: Presentation adds presenting to sectioned content, Deck gives authored slides their own reading surfaces, and Slide defines a section in an Astro composition. This article uses Presentation; Look closer uses Deck. The layout comparison renders one source through both.
The navigation says Presentations. Existing /slides/ links, content folders, and Slides imports continue to work. New decks can use format: deck, with presentations: true enabling the integration.
Present gives the slide the full page area, with the top and bottom bars hidden. The corner controls button or C brings them back as overlays, preserving the size of the slide and its live figures. Escape returns to reading; browser fullscreen remains a separate choice.
A chart with inspectable data
A plotted curve should leave its values within reach. Data and export now contains a paged table of the prepared rows supplied to the plot, a CSV of those rows, and SVG or PNG exports of the current view. The original CSV remains separately available.
Synthetic data
A damped oscillator
A synthetic analytic trajectory, not a measured experiment.
Data and export
Inspect the prepared rows plotted in this chart, or save the current chart view.
The table loads alongside the chart.
Zoom into the trace, then change its ink. The visible window stays in place; Reset view restores the whole domain. Image export captures that visible window. The data table and plotted CSV cover all prepared rows, including values outside the current zoom window.
The same controls for geometry
Models now join shaders and charts in the shared parameter API. Ordinary props set initial values; parameters exposes a small set of reader controls. Camera presets and wireframe changes update the loaded scene.
A torus knot
An original generated teaching mesh.
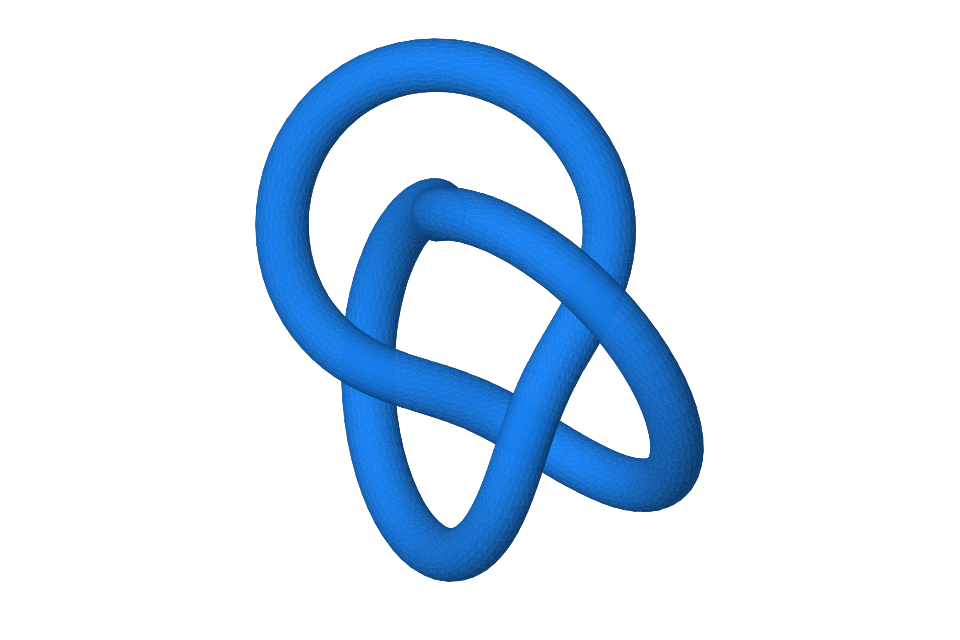
Drag to orbit · Shift + scroll to zoom
Focus, Read, and Present retain the same local figure. Parameters are local to that mounted instance; audience windows currently follow slide position, steps, and blackout rather than figure values.
Keep the source small
Plain Markdown remains the starting point. Components add behavior where it is useful, and the site’s Neutral, Paper, Chalk, and Blueprint themes work across the page and its figures.
The presentation guide, chart guide, and parameter reference describe the supported APIs. The live figures lab provides a place to try them together.