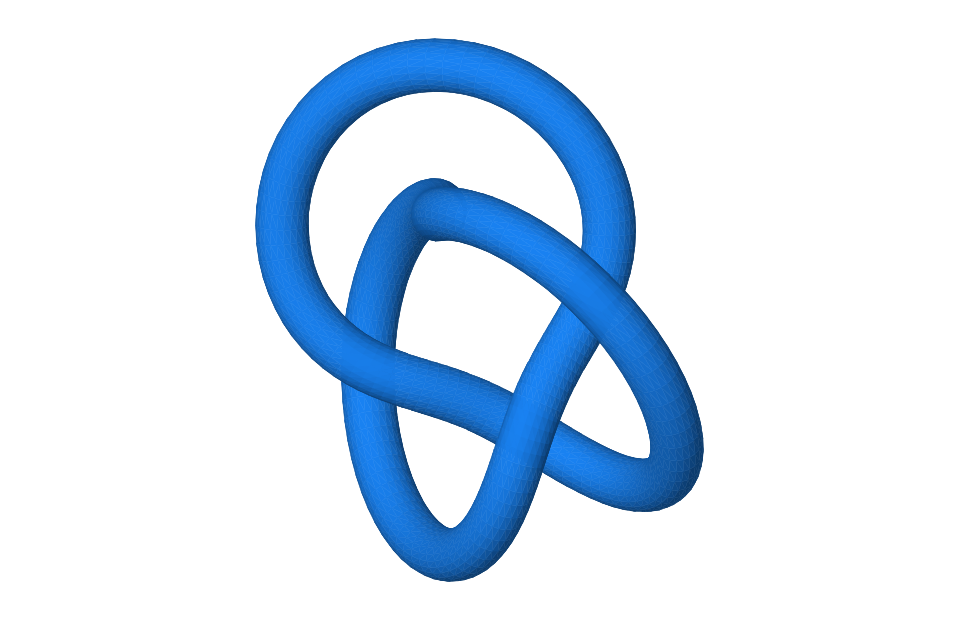
A (2, 3) torus knot. Drag to orbit, scroll to zoom, or use the camera buttons. The shape is a real, downloadable GLB.
XYZ
Drag to orbit · scroll to zoom
Model sourceexample.astroastro
---import AlkModel from '@alkemist/ui/AlkModel.astro';---<AlkModel src="/test/torus-knot.glb" poster="/test/torus-knot.svg" title="Torus knot" description="A (2, 3) torus knot. Drag to orbit or use the camera buttons."/>
Invented component counts, with a stable ink for each category.
CSVData table
The table loads alongside the chart.
Bar chart sourceexample.astroastro
---import AlkChart from '@alkemist/ui/AlkChart.astro';---<AlkChart src="/test/materials.csv" type="bar" x="material" y="value" color="material" title="Bar chart" description="Invented component counts, with a stable ink for each category." xLabel="Component" yLabel="Count" height={280} sample/>
The same counts as shares. Labels and a table keep color from carrying the explanation alone.
CSVData table
The table loads alongside the chart.
Donut chart sourceexample.astroastro
---import AlkChart from '@alkemist/ui/AlkChart.astro';---<AlkChart src="/test/materials.csv" type="donut" x="material" y="value" color="material" title="Donut chart" description="The same counts as shares. Labels and a table keep color from carrying the explanation alone." yLabel="Count" height={280} sample/>
The same eight component counts as a pie, for comparing the pie and donut treatments.
CSVData table
The table loads alongside the chart.
Pie chart sourceexample.astroastro
---import AlkChart from '@alkemist/ui/AlkChart.astro';---<AlkChart src="/test/materials.csv" type="pie" x="material" y="value" color="material" colorLabel="Component" title="Pie chart" description="The same eight component counts as a pie, for comparing the pie and donut treatments." yLabel="Count" height={300} sample/>
This section is authored in MDX. Tables, footnotes, task lists, quotations, inline math, and semantic HTML share the same theme.
A notebook is more than a paragraph.
Good research leaves a trail: an observation, a question, a source, and enough detail to try it again. Write position += velocity * dt, add an equation like E=mc2, and keep the explanation beside the experiment.
The most useful figure is the one you can ask another question of.
— A working principle for this workbench
A small experiment
Choose an initial condition.
Change one parameter at a time.
Record the result, including the surprise.
Keep units in the axis labels.
Make source data downloadable.
Repeat with a different initial condition.
Quantity
Symbol
Unit
Example
Position
x
metre
0.42
Velocity
v
metre / second
−0.18
Energy
E
joule
2.70
The oscillator here is synthetic, not a measurement.1
Small details matter, too
Water is H2O. A square metre is m2. GPU work should be optional. A surprising result deserves a second look. Correct a claim with always stable stable under the stated step-size bound.
Use Tab to move between controls. No special pointing device required.
What does “synthetic” mean here?
The values come from a deterministic formula. They test presentation and
interaction; they are not evidence about a physical system.
Footnotes
The CSV fixtures are generated from version-controlled scripts and shipped alongside each chart. ↩
Forms and controls
Inputs, a select menu, checkboxes, a range, validation, and a dialog. Changes update the preview in this browser.
Local specimen
Untitled experiment
Mathematics · 65% confidence
Add a working note and preview the card.
Source data · Handwritten annotations
The preview stays in this browser. Nothing is submitted to a server.
Why include ordinary form elements?
A theme is only useful when the quiet details work too: a long label, a selected option, a keyboard focus ring, a helpful result.
A disabled state
Use an example
Open its source above, copy the snippet, and replace the demo content.