What changes when the sources turn?
An explanation gets more useful when a reader can vary one thing and see what follows.
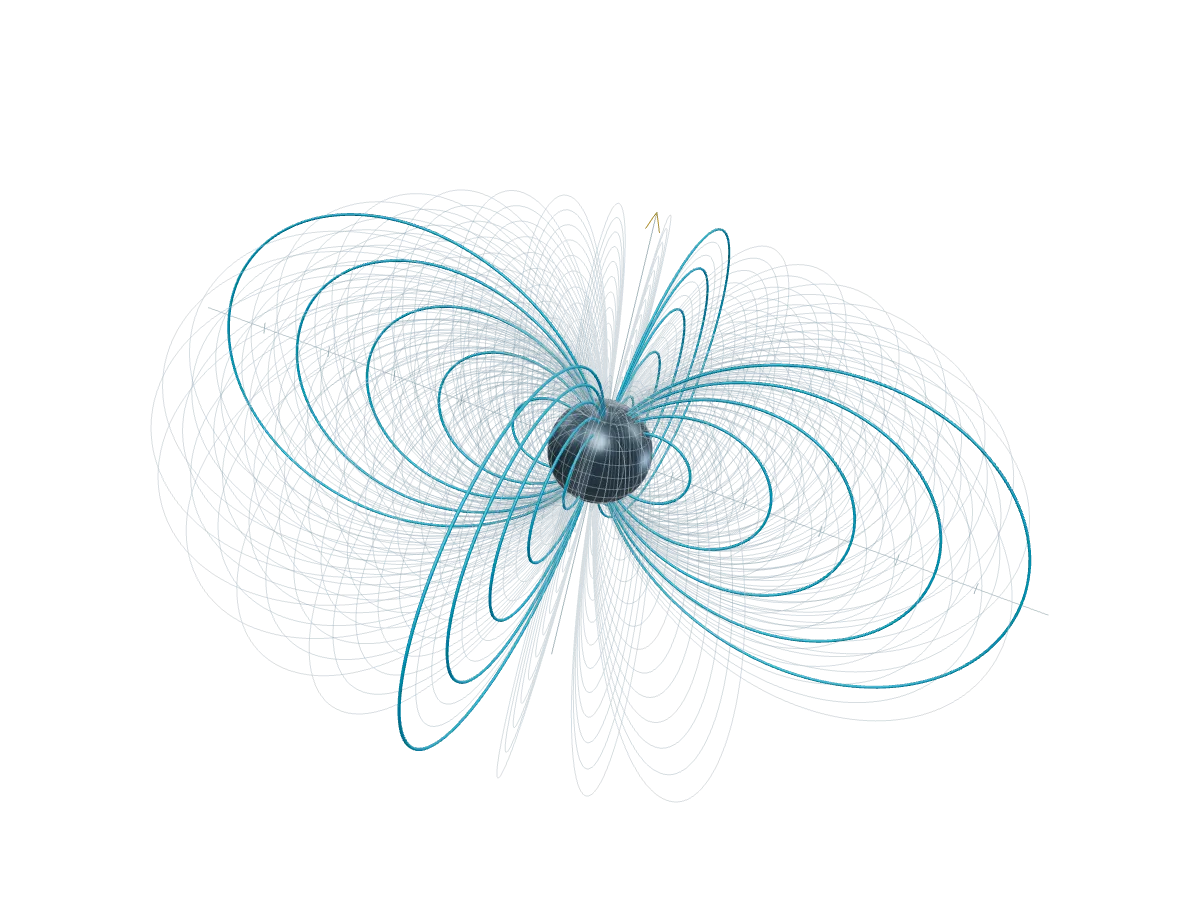
Change one thing at a time
Two-source interference
The same trace, another view
Synthetic data
A damped oscillator
Synthetic data from an analytic trajectory.
Original CSV
Shift + scroll to zoom · drag to pan
Data and export
Inspect the prepared rows plotted in this chart, or save the current chart view.
The table loads alongside the chart.
Page 1 of 1
Keep the source small
Choose the controls a reader needs. The initial values are ordinary component props.
<Shader frequency={9} angle={24} parameters />Return from Focus with Escape. Move between Read and Present without resetting the figure.