A signal is a claim in motion
The useful unit is not a chart. It is a trace, a model, and a question that can still be checked.
Begin with the surface
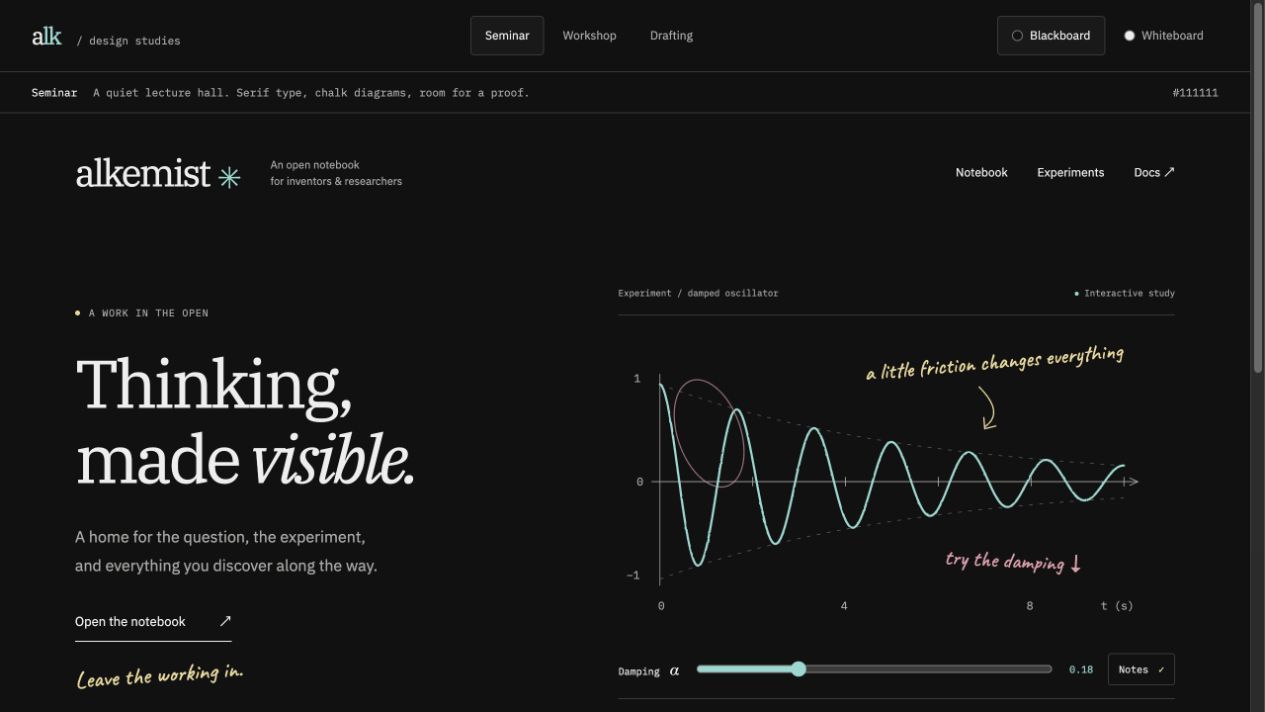
This is a site study, not an observation. The data used later is synthetic.1
Name the quantities before the curve
| Quantity | Meaning | Unit |
|---|---|---|
| elapsed time | s | |
| displacement | m |
Let the short model stay inspectable
const damping = 0.18;
const frequency = 2.4;
const displacement = (time: number) =>
Math.exp(-damping * time) * Math.cos(frequency * time);A result should leave a trail
flowchart LR
  Source[Source file] --> Figure[Inspectable figure]
  Figure --> Claim[Written claim]
  Claim --> Question[Next question]
The point is not a beautiful diagram. It is a path back to what the diagram means.